Year: 2012-2016
Type: Broadcast touchscreen
Employer: Reality Check Systems
Project roles:
• Lead developer
• UI design and layout design
• VizRT implementation, animation, and scripting
• Multinational studio support and analyst training (including extensive travel to London, Paris, Germany, and Qatar)
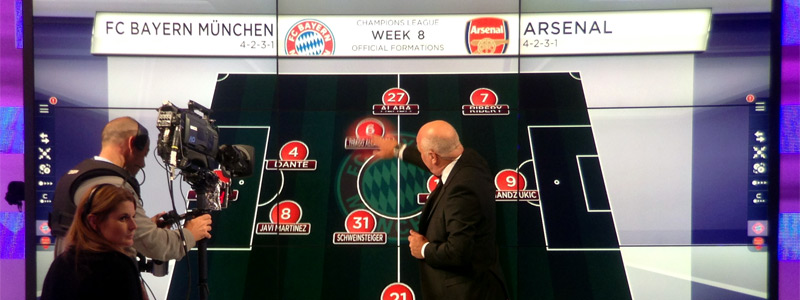
Now in its second major version, RCS LaunchPad is a broadcast touchscreen solution that provides soccer analysts on live broadcasts a multitude of interactive and in-depth match, league, team, and player data.
LaunchPad gives analysts great flexibility in crafting stories about numerous soccer leagues worldwide. Analysts can explore fixtures and results, predicted and official formations, shot plots, pass maps, league standings, top scorers, and more. In addition, analysts can use various telestration tools to diagram video replays.
While the underlying LaunchPad engine is the same from client to client, the look—the colors, the fonts, and more—can be customized for each client. Also, clients can freely translate the text labels as LaunchPad supports multiple languages—including right-to-left languages like Arabic (in addition to reversing the text, LaunchPad also reverses any left-to-right animations, menus, and interactions).
As the lead developer of LaunchPad, I performed roles including working with colleagues to brainstorm and implement new sections and data feeds; building, scripting, and animating each section; building new client looks from supplied design frames; exploring user-interface options; creating icons; and traveling to clients for studio support and to train analysts and staff.
One of my favorite details in RCS LaunchPad is scrolling a list of ranked items with several items sharing a rank. Rather than have the rank repeated or have it appear once locked on the first item and subsequently scrolled outside of the viewing window, the rank number floats between the tied items until it is pushed out by the next rank number. And as the rank number floats, it intelligently colorizes itself based on the highlight state of the bar underneath.
Data tables like league standings can be sorted by any of the columns.
The labels in the title bars can be pulled down to reveal corresponding menus. For example, pulling down on a league logo will reveal the list of available leagues. Pulling down on the subsection reveals the sibling subsections. And pulling down on an open menu allows fast switching between menus.